Upload a Photo Upload a Video Add a News article Write a Blog Add a Comment
Blog Feed News Feed Video Feed All Feeds

Folders


Marmonte League XC Retrospective - Part 2: The Final Championship

Published by
DyeStatCAL.com   Nov 8th 2013, 7:36pm
Comments


Back to Part 1 

The Final Championship

      The boys and girls of the Marmonte League did not disappoint!  Sarah Baxter lowered her course record to 16:22 and the Simi girls lowered the team time record by 29 seconds as well. On the boys side, Westlake and Simi gave us a show, with Westlake coming out on top 40 to 47, with two of the top 5 team times ever run.  It also should be noted that Mikey Giguere and Juan Jimenez ran the #3 and 4 times ever on the course, with Jimenez being the fastest Junior ever.  Here are the Full Results of yesterday's final Marmonte League Final.  

Top Lists

      As promised, here is a closer look at the actual performances on the Marmonte League Championship Course at Agoura High School, plus a little more historical analysis to follow. Yesterday was the final Marmonte league Championship and it did not disappoint!  We saw 4 boys and 3 girls jump onto (or move up) the individula Top 10 All-Time lists, and 2 boys and 2 girls teams do the same.  

      Thanks to coach Joe Snyder of Westlake High, I was able to get the missing course history which actually started in 1998, not 1992 as I previously heard.  Here are the long awaited lists.


Boys Top 10 Individuals

Rank Name Time School Year
1 Michael Cybulski 14:51 Royal 2006
2 Travis Edwards 14:57 Royal 2009
3 Mikey Giguere 15:02 Westlake 2013
4 Juan Jimenez 15:03 Simi Valley 2013
5 Dylan Jaedtke 15:09 Royal 2004
6 Kevin Joerger 15:13 Thousand Oaks 2009
7 Hudson Andrews 15:16 Royal 2006
8 Michael Picchini 15:18 Moorpark 2013
9 Garrett Lepine 15:21 Simi Valley 2013
9 Cory Primm 15:21 Westlake 2005
9 Sean Davidson 15:21 Royal 2009

Boys Top 10 Teams

Rank School Time Year Average
1 Royal 77:11 2009 15:26
2 Royal 77:48 2006 15:33
3 Westlake 77:51 2013 15:34
4 Simi Valley 77:56 2013 15:35
5 Thousand Oaks 78:25 2008 15:41
6 Westlake 78:33 2012 15:42
7 Royal 78:45 2004 15:45
8 Royal 78:59 2005 15:47
8 Royal 78:59 2008 15:47
10 Royal 79:12 2003 15:50


Girls Top 10 Individuals

Rank Name Time School Year
1 Sarah Baxter 16:22 Simi Valley 2013
2 Liberty Miller 17:17 Simi Valley 2009
3 Anna Sperry 17:23 Simi Valley 2006
4 Erika Barr 17:44 Simi Valley 2011
5 Kaitlyn Wood 17:47 Simi Valley 2013
5 Brianne Holland 17:47 Royal 2011
7 Jasmine Hayes 17:48 Westlake 2005
8 Olivia Rosellini 17:49 Simi Valley 2013
9 Karla Vernola 17:50 Simi Valley 2011
10 Laura Jakosky 17:51 Agoura 2000

Girls Top 10 Teams

Rank School Time Year Average
1 Simi Valley 88:36 2013 17:43
2 Simi Valley 89:07 2011 17:49
3 Simi Valley 89:37 2012 17:55
4 Thousand Oaks 91:59 2005 18:23
5 Thousand Oaks 92:42 2011 18:32
6 Simi Valley 93:07 2009 18:37
7 Moorpark 93:48 2013 18:45
8 Thousand Oaks 93:56 2004 18:47
9 Simi Valley 94:04 2010 18:48
10 Moorpark 94:16 2012 18:51


      So was 2013 the best year ever?  I guess it all depends how you measure it.  We certainly had the fastest girls team ever and what appears to be the deepest boys field ever. But with all this data already loaded into Excel, we have to do a couple more calcuations don't we?

      I scored all 16 years data looking at the top 7 runners of each year rather than team. Here's where they ended up:

Girls Scoring by Year

Team  Score  Avg Time
2011 47 17:39
2013 61 17:34
2005 102 17:56
2012 115 17:48
2004 221 18:18
2009 227 18:13
2007 234 18:27
2002 297 18:28
2010 359 18:34
2006 371 18:29
1998 377 18:36
2001 392 18:40
2008 439 18:43
2000 524 18:46
1999 543 18:50
2003 597 18:54

Top 3 "Year Teams":

2011  
 
       
# Pl Name Time
1 3 Sarah Baxter 17:03
2 7 Erika Barr 17:44
3 9 Brianne Holland 17:47
4 12 Karla Vernola 17:50
5 16 Jenny Giguere 17:54
6 17 Monika Gyalay 17:55
7 26 Melanie Joerger 18:06
       
Score 47 Team Time 88:19
  9 Average 17:39
    Gap 0:51
       
2013  
 
       
# Pl Name Time
1 1 Sarah Baxter 16:22
2 8 Kaitlyn Wood 17:47
3 11 Olivia Rosellini 17:49
4 20 Brianne Holland 17:57
5 21 Beth Wade 17:59
6 34 Monika Gyalay 18:13
7 36 Samantha Barajas 18:15
       
Score 61 Team Time 87:54
  12 Average 17:34
    Gap 1:37
       
2005  
 
       
# Pl Name Time
1 6 Anna Sperry 17:27
2 10 Jasmine Hayes 17:48
3 24 Kaitlyn Sullivan 18:03
4 27 Lynne Fletcher 18:11
5 35 Allie Lopez 18:14
6 48 Erin Baird 18:21
7 58 Kelcie Wiemann 18:27
       
Score 102 Team Time 89:44
  20 Average 17:56
    Gap 0:46


Boys Scoring by Year

Team  Score Avg Time
2013 40 15:14
2009 50 15:16
2006 134 15:27
2008 140 15:34
2012 160 15:36
2005 179 15:36
2004 206 15:38
2011 288 15:48
2007 295 15:48
2003 295 15:47
2002 446 15:56
2010 532 16:01
2001 1221 16:30
1999 1484 16:46
2000 1491 16:46
1998 1610 16:53


Top 3 "Year Teams":

2013  
 
       
# Pl Name Time
1 3 Mikey Giguere 15:02
2 4 Juan Jimenez 15:03
3 8 Michael Picchini 15:18
4 10 Garrett Lepine 15:21
5 15 Sean O'Bryan 15:24
6 21 Michael Powell 15:29
7 22 Logan Beteta 15:30
       
Score 40 Team Time 76:11
  8 Average 15:14
    Gap 0:21
       
2009  
 
       
# Pl Name Time
1 2 Travis Edwards 14:57
2 6 Kevin Joerger 15:13
3 12 Sean Davidson 15:21
4 13 Sean Grumney 15:22
5 17 Paul Jesson 15:27
6 19 Korey Yoakum 15:28
7 28 Michael Vorgitch 15:33
       
Score 50 Team Time 76:21
  10 Average 15:16
    Gap 0:29
       
2006  
 
       
b Pl Name Time
1 1 Michael Cybulski 14:51
2 7 Hudson Andrews 15:16
3 33 Jun Reichl 15:36
4 43 Alex Routh 15:44
5 50 Chris Baird 15:47
6 87 Sean Gildea 16:00
7 117 Clayton Graham 16:06
       
Score 134 Team Time 77:16
  27 Average 15:27
    Gap 0:55


      Using this measure, 2013 was second for girls and first for boys - and certainly the best year on a combined basis. Note that the top 7 boys come from 5 different schools this year - a testament to the depth on the boys side.

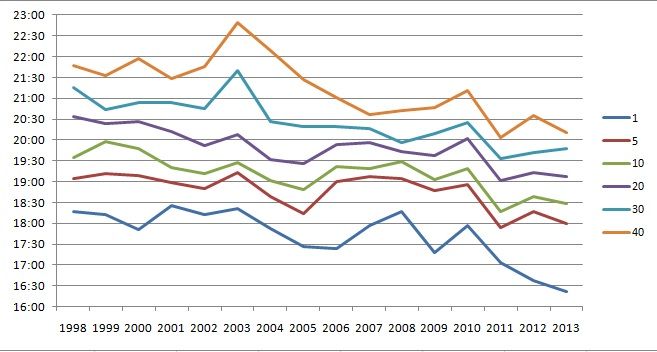
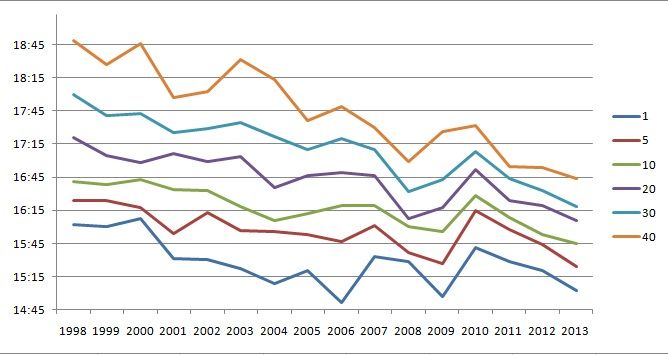
      For our last look, I took a sampling of performances for each year to build a some trend lines for both the boys and girls. I graphed #1,5,10,20,30,and 40 performance for each year. Keep in mind that with an 8 team league, a full field contains 56 runners. Here are the trend charts for both boys and girls:


Girls 1998 to 2013

Marmonte League XC Girls Progression

      The the times of the Marmonte girls have continued to trend down, with 2013 coming nearly even with 2011.


Boys 1998 to 2013 

Marmonte League XC Boys Progression

      As you can see from the boys trend, well, the Marmonte boys are ridiculous!  A 16:45 will only get you 40th place in 2013, while it would have put you just outside the top 10 in 2000.  The consistency of the marks at the front is astounding.

Conclusion

     In 2012 I looked at this data and saw that the Thousand Oaks team was the fastest ever to stay home from CIF Prelims with an 81:46 team time (16:21 average). That pales in comparison to 2013, with Newbury Park staying home with a scorching 80:23 (16:05 average). Perhaps this is just more of a indicator that a split is best to level the playing field a bit.

      So that's a wrap for the Super Marmonte League Cross Country League Finals. We still have 3 girls teams and 4 boys teams going to post season, plus several outstanding individuals. Best of luck to everyone with their post season and with your new league affilliation for 2014!

- Scott


Credits: I must give credit to those who supplied much of this data, including Ken Reeves, Chad Scott, Joe Snyder, Bill Duley, and Jack Farrell. Thanks for sharing this history with us!


More news

History for TOHS Cross Country
YearVideosNewsPhotosBlogs
2023 2      
2021 1 1    
2019 14 1    
Show 16 more
 
+PLUS highlights
+PLUS coverage
Live Events
Get +PLUS!